In GA4, bounce rate is the percentage of sessions that were not engaged—calculated as 100% minus engagement rate. That simple line hides a lot of nuance, especially for teams still using Universal Analytics logic. Confusion around definitions creates noisy dashboards and poor decisions.
Most guides still apply UA-era thinking or generic ranges that don’t reflect GA4’s engagement-first measurement. That leads to misinterpretation and misguided fixes. The better path is clarity: understand the GA4 formula, configure the right events, and evaluate intent by page type.
Expect a practical walk-through: what is bounce rate in SEO under GA4, how to find and customize it, realistic benchmarks, and a diagnostic checklist to reduce bounce rate where it matters—with examples, tooling, and references.
What Bounce Rate Means in GA4 (and How It Differs from UA)
Direct definition and formula in GA4
GA4 reframes bounce rate around engagement, not pageviews. GA4 bounce rate is the percentage of sessions that are NOT engaged. Put another way: Engagement rate + Bounce rate = 100%. That relationship makes bounce rate calculation straightforward—start with engagement rate and subtract from 100. An engaged session occurs when a user stays for at least 10 seconds, views two or more pages/screens, or triggers a conversion event. This engagement-first approach reduces false negatives on interaction-heavy pages, such as tutorials with video or product pages with dynamic components. Practically, GA4 bounce rate should be interpreted alongside average engagement time, conversions, and the nature of the landing page to assess intent satisfaction and UX quality. When asking what is bounce rate in SEO, GA4’s definition provides a more meaningful lens for organic performance.
GA4 vs. Universal Analytics: what changed and why
Universal Analytics defined a bounce as a single-page session with zero interaction hits. That created problems. Single-page sessions on long-form content or interactive tools could look “bad” despite satisfying intent. GA4 shifts focus to engagement, acknowledging that time on page, additional pageviews, and key events reflect user value. The change reduces artificial inflation for pages where clicks aren’t necessary to succeed—think calculators, interactive FAQ accordions, or embedded video modules. GA4 bounce rate aligns better with modern UX patterns, including SPA frameworks where pageviews are less frequent. For SEO analysis, this matters: bounce rate and SEO shouldn’t be judged on single-hit logic anymore. GA4 bounce rate is not a ranking signal, but it’s a stronger proxy for experience quality that supports decisions on content readability, internal linking, and page speed optimization.
Engaged session criteria explained
Three criteria drive engagement in GA4: time, page/screen count, and conversion events. First, engagement time: a session is engaged if it lasts at least 10 seconds. Second, page depth: two or more pages or screens qualify. Third, conversion events: any marked key event (e.g., click-to-call, add to cart, video completion) makes a session engaged regardless of time or depth. Each criterion has strategic implications. Increasing engagement time often requires better above-the-fold content and faster rendering to avoid early abandonment. Boosting page depth benefits from clear information architecture and internal linking to logical next steps. Conversion events demand thoughtful configuration—track scroll depth, outbound clicks, file downloads, and meaningful interactions. A how‑to post with scroll tracking and video play events will see engagement rate rise, dropping GA4 bounce rate compared to UA’s single-page sessions.
Bounce Rate vs. Exit Rate: Key Differences and Use Cases
Definitions with common scenarios
Bounce rate measures the share of sessions that did not become engaged on the landing page. Exit rate measures the share of pageviews that were the last in a session, regardless of where the session started. Consider a simple journey: a user lands on Page A, clicks to Page B, then leaves from Page C. Page C records an exit, but the session is not a bounce because it included multiple pageviews and likely sufficient engagement. Confusing these metrics obscures insights. Bounce rate speaks to landing page intent match and immediate UX quality. Exit rate helps locate drop-off points later in the journey—product comparisons, cart steps, or support paths. For SEO teams, pairing both with behavior flow and segmenting by device/source clarifies where users stall or succeed.
When to use each metric
Use bounce rate when evaluating landing pages and entry experiences: search snippets, meta titles and descriptions, hero messaging, and content clarity above the fold. It’s ideal for understanding whether users quickly find relevance. Use exit rate to diagnose later‑stage friction: checkout pages, documentation loops, or video hubs. Typical applications include funnel analysis, onboarding flows, and identifying content gaps where internal linking should guide next actions. Action steps often differ. Bounce-focused changes prioritize early intent alignment, speed, and scannability. Exit-focused changes target journey continuity—related links, CTAs, FAQs, or alternative paths. To get a complete picture, segment by device category (mobile vs. desktop), source/medium (organic vs. paid social), and user type (new vs. returning). These segments prevent aggregate fallacies and reveal why one channel’s exit rate may be acceptable while another’s bounce rate is problematic.
Common misconceptions
Two myths persist. First: “Lower is always better.” Not necessarily. Answer pages, phone/contact pages, and support docs may serve a task quickly; higher bounce or exit can reflect satisfied intent. Second: “Bounce rate is a ranking factor.” Google has stated it’s not a direct ranking signal; focus should remain on UX, relevance, and Core Web Vitals. Another misconception is treating bounce and exit as interchangeable; they track different behaviors and should guide different fixes. A page with a high exit rate after a successful conversion is not broken. Conversely, a landing page with poor engagement deserves scrutiny. Tie these metrics to qualitative tools—session recordings, heatmaps—and validate changes with controlled experiments. When stakeholders ask what is bounce rate in SEO, align expectations: it’s a diagnostic metric, not a goal in itself.
How to Find and Calculate Bounce Rate in GA4
Add Bounce Rate to standard reports
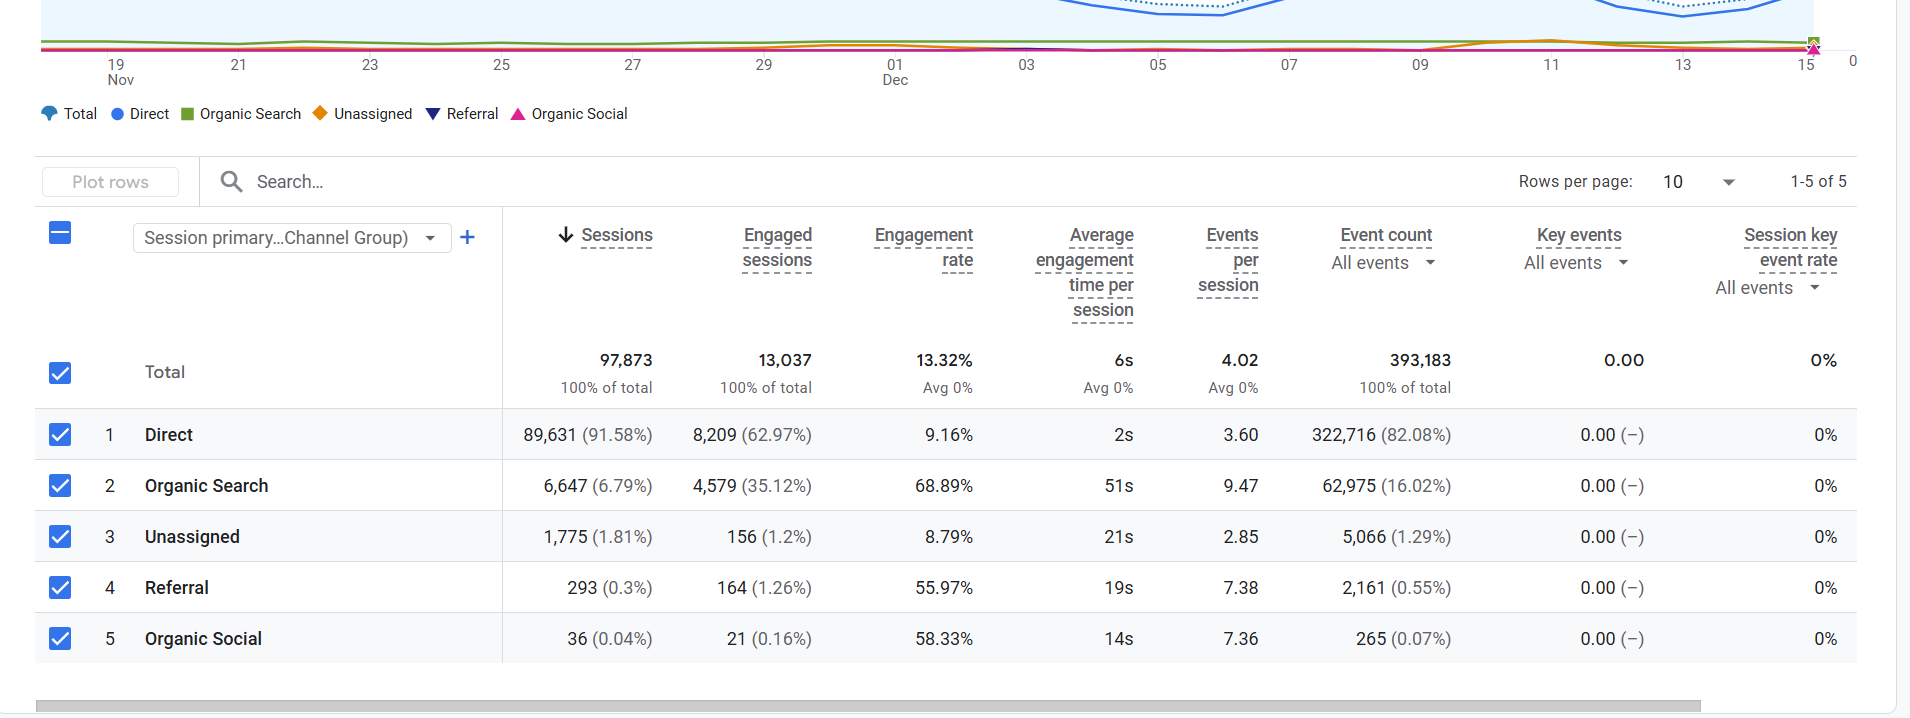
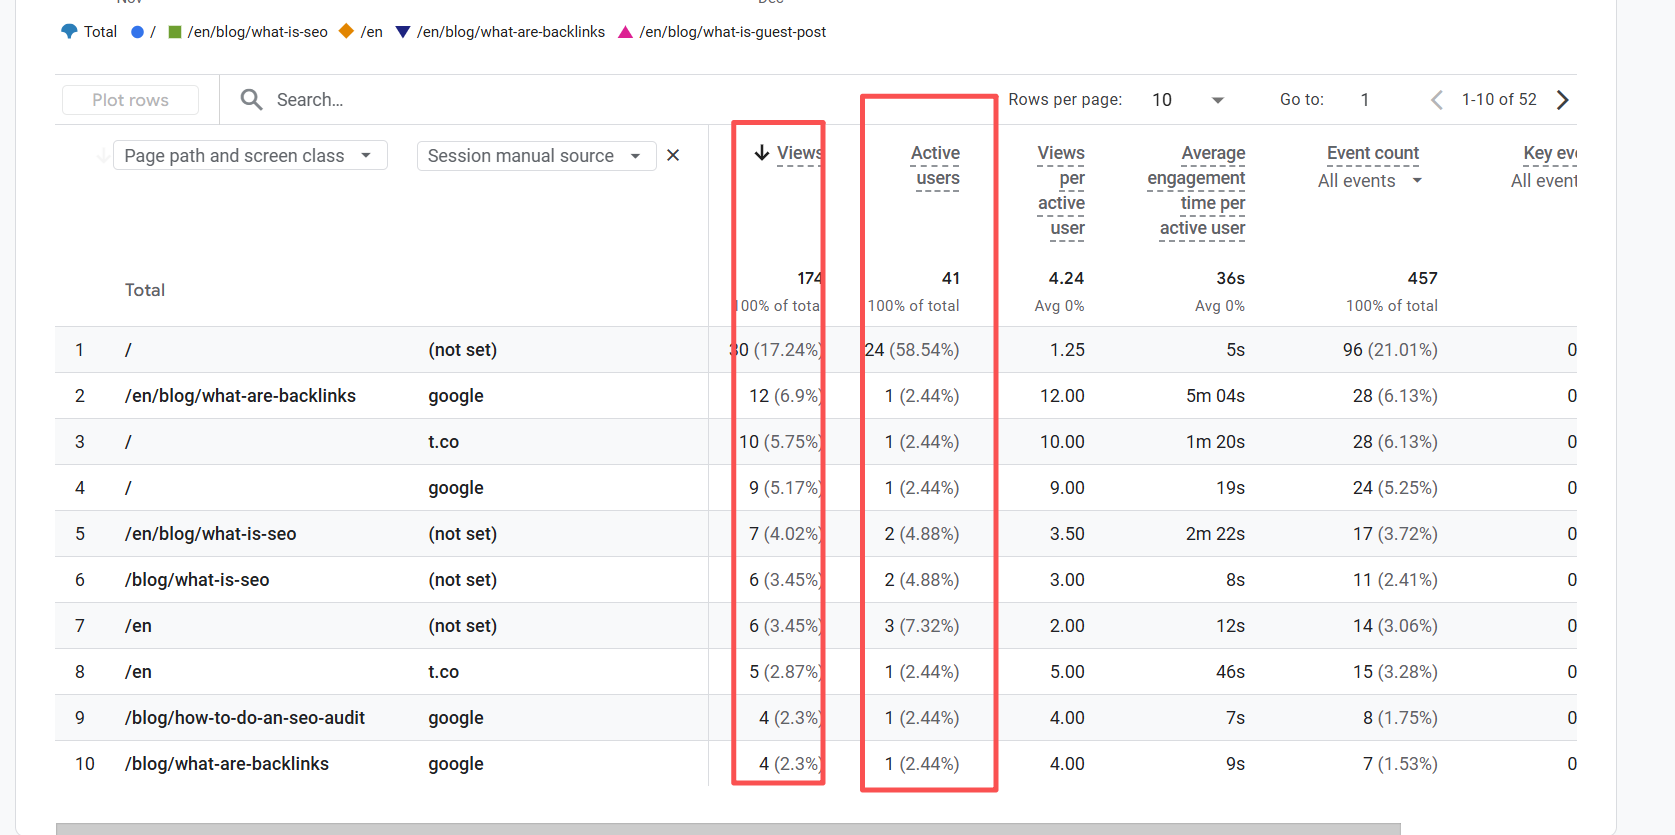
GA4 hides bounce rate by default, but it’s easy to add. In Reports > Engagement > Pages and screens, click Customize. Open Metrics, add Bounce rate, and save to the current report or as a new report. For deeper analysis, build a Landing Page report in the Report Library: Create > Detail report. Use dimensions such as Landing page + query string, Source/Medium, and Device category. Include metrics like Bounce rate, Engagement rate, Average engagement time, and Conversions. This setup connects engagement to acquisition and device differences, making the bounce rate calculation actionable. Remember: GA4 bounce rate = 100% − engagement rate. Verify data populates correctly and reflects actual user behavior. Documentation: GA4 Help Center on engaged sessions (https://support.google.com/analytics/answer/9756891) and report customization.
Build an Exploration and useful segments
Explorations provide flexible, segment‑based analysis. Create a Free‑form exploration with Dimensions: Landing page, Source/Medium, Device category, and New/Returning. Add Metrics: Bounce rate, Engagement rate, Average engagement time, and Conversions. Build segment comparisons—Mobile vs. Desktop, Organic vs. Paid, New vs. Returning—to isolate patterns missed in top-level reports. Consider custom breakdowns: campaign type (paid social often higher bounce than branded organic), region, or consent status (which can affect event tracking). Validate that bounce rate aligns with engagement rate at 100%—a quick check to catch configuration issues. Add breakdowns for content groups (blogs, product pages, docs) to assess average bounce rate by page type. This framework reveals where to reduce bounce rate and where an observed “high” number aligns with fast intent completion.
Configure meaningful engagement events (GTM)
Tracking meaningful interactions elevates GA4’s engagement rate and accuracy. Enable Enhanced Measurement in GA4 (scroll, outbound clicks, site search) to cover common actions: https://support.google.com/analytics/answer/9216061. In Google Tag Manager, configure custom events that reflect real engagement. For scroll depth, fire events at 50% and 90%; map them to GA4 as custom events and mark only truly valuable actions as key events. For video, track YouTube or embedded players—start, 25%, 50%, 75%, and completion—and consider marking completion as a key event. Ensure outbound clicks and file downloads include parameters like linkurl and fileextension for analysis. Validate setups using GA4 DebugView (https://support.google.com/analytics/answer/7201382) and GTM Preview (https://support.google.com/tagmanager/answer/6107056). Mini example: after enabling scroll and video events on a tutorial page, engagement rate rose from 42% to 66%, and bounce rate fell accordingly within two weeks.
Benchmarks and When a High Bounce Rate Is Acceptable
Benchmarks by industry and page type
GA4-era benchmarks should reflect engagement-first logic, not UA’s single-hit perspective. Typical ranges vary by page type: - Blogs/guides: 45–75% GA4 bounce rate, depending on content depth and query intent. - Ecommerce product pages: 20–45%, influenced by price, availability, and merchandising. - Docs/help articles: 40–70%, often higher due to quick-answer behavior. - Conversion-focused landing pages: 25–50%, tighter when aligned to high-intent campaigns.
Industry matters. Media sites trend higher due to snackable content; B2B SaaS often sits mid-range as users evaluate multiple assets; ecommerce strives for lower bounce via merchandising and filters. Use confidence intervals, monitor sample size, and compare periods with similar traffic mixes. Benchmarks are directional—calibrate targets per page purpose.
Channel, device, and intent nuances
Channels carry intent. Paid social typically has higher bounce than branded organic; display tends to skew even higher. Email to landing pages can be low when aligned to a clear offer. Device also matters: mobile often shows higher bounce due to time constraints and UX friction, magnified by Core Web Vitals challenges. Intent context changes the story. Navigational or quick-answer queries may lead to higher bounce with satisfied users. Transactional pages should trend lower and show stronger conversion rates. Segment benchmarks by Source/Medium and Device category to avoid chasing a misleading sitewide average bounce rate. When asking what is bounce rate in SEO, consider the acquisition lens: intent plus UX dictates interpretation.
Acceptable high-bounce cases with examples
Some pages should not be judged by bounce alone. Examples: - Contact or phone pages where click‑to‑call occurs and the task completes offsite. - Knowledge base articles that answer a single question; users leave satisfied. - Store hours or location pages; quick utility with minimal on-page exploration. - Press releases or investor updates; intent is informational and time-bound.
In these cases, define key events—click‑to‑call, copy address, map interaction—and prioritize task completion metrics over raw bounce. High exit rate may also be fine if conversion or task completion occurred earlier. Report these exceptions to stakeholders with context: page purpose, intent, and measurable outcomes. Chasing a lower bounce rate universally can backfire when it adds friction without improving satisfaction.
Diagnostic Checklist and Tactics to Reduce Bounce Rate
Diagnose by segment: page, device, and source
Start with a decision path: 1) Identify outlier landing pages with high bounce and low engagement time. 2) Segment by Device category (mobile vs. desktop) to spot mobile-specific friction. 3) Segment by Source/Medium (organic, paid social, email) and New vs. Returning users.
Look for patterns: high mobile bounce on media-heavy pages suggests performance issues; paid social outliers point to mismatched creative versus landing content. Overlay behavior flow to see where journeys stall. Compare GA4 bounce rate with engagement rate and conversions to avoid false positives. Document hypotheses and expected impact. A structured segmentation prevents overreacting to normal high-bounce scenarios and clarifies where targeted changes will reduce bounce rate meaningfully.
Top causes and targeted fixes
Frequent causes include slow rendering, unclear messaging, intrusive interstitials, and poor content readability. Targeted fixes: - Speed: address Core Web Vitals—LCP, INP, CLS—using PageSpeed Insights/Lighthouse; compress images, preload critical CSS, and streamline scripts. - Content-intent alignment: sharpen H1 and intro, answer the primary query early, add jump links and scannable headings. - UX friction: reduce popups, stabilize layout to avoid CLS, simplify CTAs, and clarify next steps with internal linking. - Mobile optimization: improve tap targets, simplify navigation, compress hero media, and defer nonessential resources. - Above-the-fold content: present key value rapidly; avoid pushing critical copy below large banners. - Enrichment: add FAQs, visuals, code snippets, short videos, and comparison tables. These changes should be validated against segments most affected. For ecommerce, category filters and merchandising often outperform cosmetic tweaks; for blogs, structure and readability matter more.
Tools, monitoring, and reporting workflows
Tooling accelerates insight and accountability: - A/B testing: run experiments using GA4 audiences and third‑party tools; test hero copy, layout, or CTA placement. - Heatmaps/session recordings: use Hotjar or Microsoft Clarity to observe scroll behavior and interaction gaps. - Dashboards: build a Looker Studio report with Bounce rate, Engagement rate, Engagement time, and Conversions by Landing page/Device/Source. - Alerts: set GA4 custom insights for sudden changes in engagement or bounce; tie to release notes. - Performance: monitor Core Web Vitals and regressions via PageSpeed Insights and Search Console’s CWV report. Mini case study: a retail category page dropped mobile bounce from 68% to 49% after compressing hero images, adding a sticky filter, and clarifying the H1 and above-the-fold product count. Measure success by task-specific key events—add to cart, click‑to‑call, or download—because not every page should optimize purely for bounce reduction.
Conclusion
GA4 reframes bounce rate around engagement, making definitions, configuration, and segmentation essential for accurate interpretation. Intent-calibrated benchmarks, device/source/page diagnostics, and targeted UX, speed, and content fixes turn a noisy metric into actionable insight. For teams evaluating what is bounce rate in SEO, GA4’s engagement lens delivers a clearer signal of demand fulfillment.
Download the GA4 Bounce Rate Diagnostic Checklist and GTM engagement tracking template, and book a free 20‑minute analytics audit to validate your setup.
FAQS
How do you find bounce rate in Google Analytics 4?
In Reports > Engagement > Pages and screens, click Customize, add the Bounce rate metric, and save. Or build an Exploration with Landing page and Bounce rate; segment by device and source. Verify engaged events are configured.
Is bounce rate a Google ranking factor?
No, Google has stated bounce rate isn’t a direct ranking signal. Improving it can still help SEO indirectly via better UX, intent satisfaction, and Core Web Vitals.
What is a good bounce rate for blogs, ecommerce, and landing pages?
GA4-era ranges vary: blogs/docs trend higher; ecommerce product and high‑intent landing pages trend lower. Calibrate by industry, device, and channel rather than using a single sitewide target.
Why did my bounce rate suddenly increase in GA4?
Common causes: loss of enhanced measurement/events, tag or consent changes, traffic mix shifts (e.g., paid social), page speed regressions, UX changes. Check DebugView, Realtime, traffic source trends, and release notes.
How is bounce rate calculated in GA4 vs Universal Analytics?
GA4: Bounce rate = 100% − Engagement rate; engaged session = ≥10s, ≥2 pages/screens, or ≥1 conversion. UA: bounce = single‑page session with no interaction hits.